The context of the Earth changes is 4 billion years. It’s been doing this for that long. Humans only arrived on scene 1 million years ago, approximately so we are a new species here. We need to calm down and LEARN about the earth and its ways so we can cooperate with all evolving life forms peacefully and continue to thrive here, not just survive and obey the edicts on the news as though it’s God.
The purpose of this section of my blog is not to fear monger cataclysm for the federal government or any other agency who wants to institute A.I. on Earth. You know I believe natural evolution will continue here and so must our bodies.
To achieve that through the earth changes, it’s important to know that our bodies and minds contain eternity, the eternal NOW, AS TIME, expressed in LIGHT AND COLOR in the auroras as the collective emanations of the etheric aura of all DNA forms. They are emanating our 52-day cycles. The Maya left these time patterns for us on Earth thousands of years ago.
The Red Light 52-day cycle is kin 1-52
The White Light 52-day cycle is kin 53-104
The Blue Light 52-day cycle is kin105-156
The Yellow Light 52-day cycle is kin 157-208
The Green Light 52-day cycle is kin 209-260
The Tzolkin IS TIME, as OUR BODIES and All DNA.
Every day happens all at once in one Gestalt of Time, which is Eternity. But because of evolution, we can see it in pieces. Because we see it in snippets, we believe it exists in pieces, like a day, but it does not. Every day is eternally a day and night, like the movie Groundhog Day, but without the time warp. As we change our minds and hearts, the time warp ends so that every day LOOKS AND FEELS different.
Time is ONE WHOLE, all of the time as the double strand DNA, the past, and the future, which are actually just partial projections of what we’ve created before.
As soon as today arrives, tomorrow is gone, so tomorrow IS TODAY. There is no “live” past, there is only now. We just have memories of events and feelings. The 3D pieces we see or have are only shadows of time. They aren’t alive.
Only DNA that has some form of breath is alive. Everything living breathes in its own way. It doesn’t breathe like animals, but it breathes.
There is no set future because of FREE WILL. The future is created based on what THE COLLECTIVE MIND wants, which I read all of the time and thus make predictions. But it’s never set in stone. No one can predict the future for sure. They only see their perspective from their point in time, but the collective is always changing its mind!! We are not of the same mi d as our ancestors when some fellow we know harps on that. We are US.
We can only see it in the Tzolkin as the 7th harmonic run, the axis of the eternal present, the Mystic Column that pulses to our CNS or brain and spine. It is kin 121-140, and I’ve posted on it continually. Just search on the Mystic Column in the search box, and more information will come up. And the GAP kin are the activation points on our spine for our eternal DNA, so heads up when those hit.
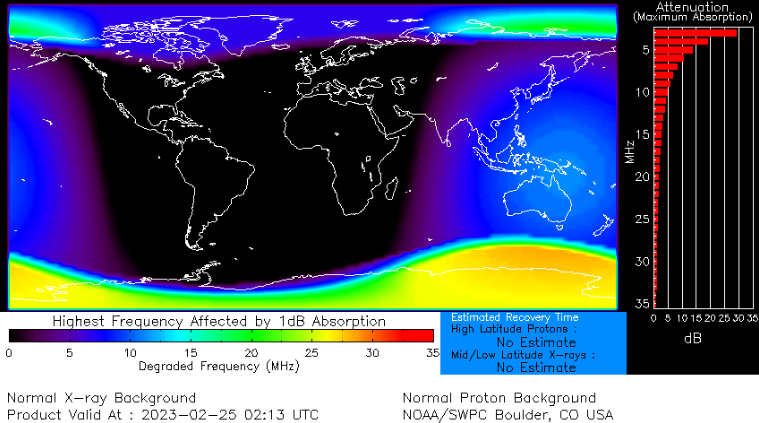
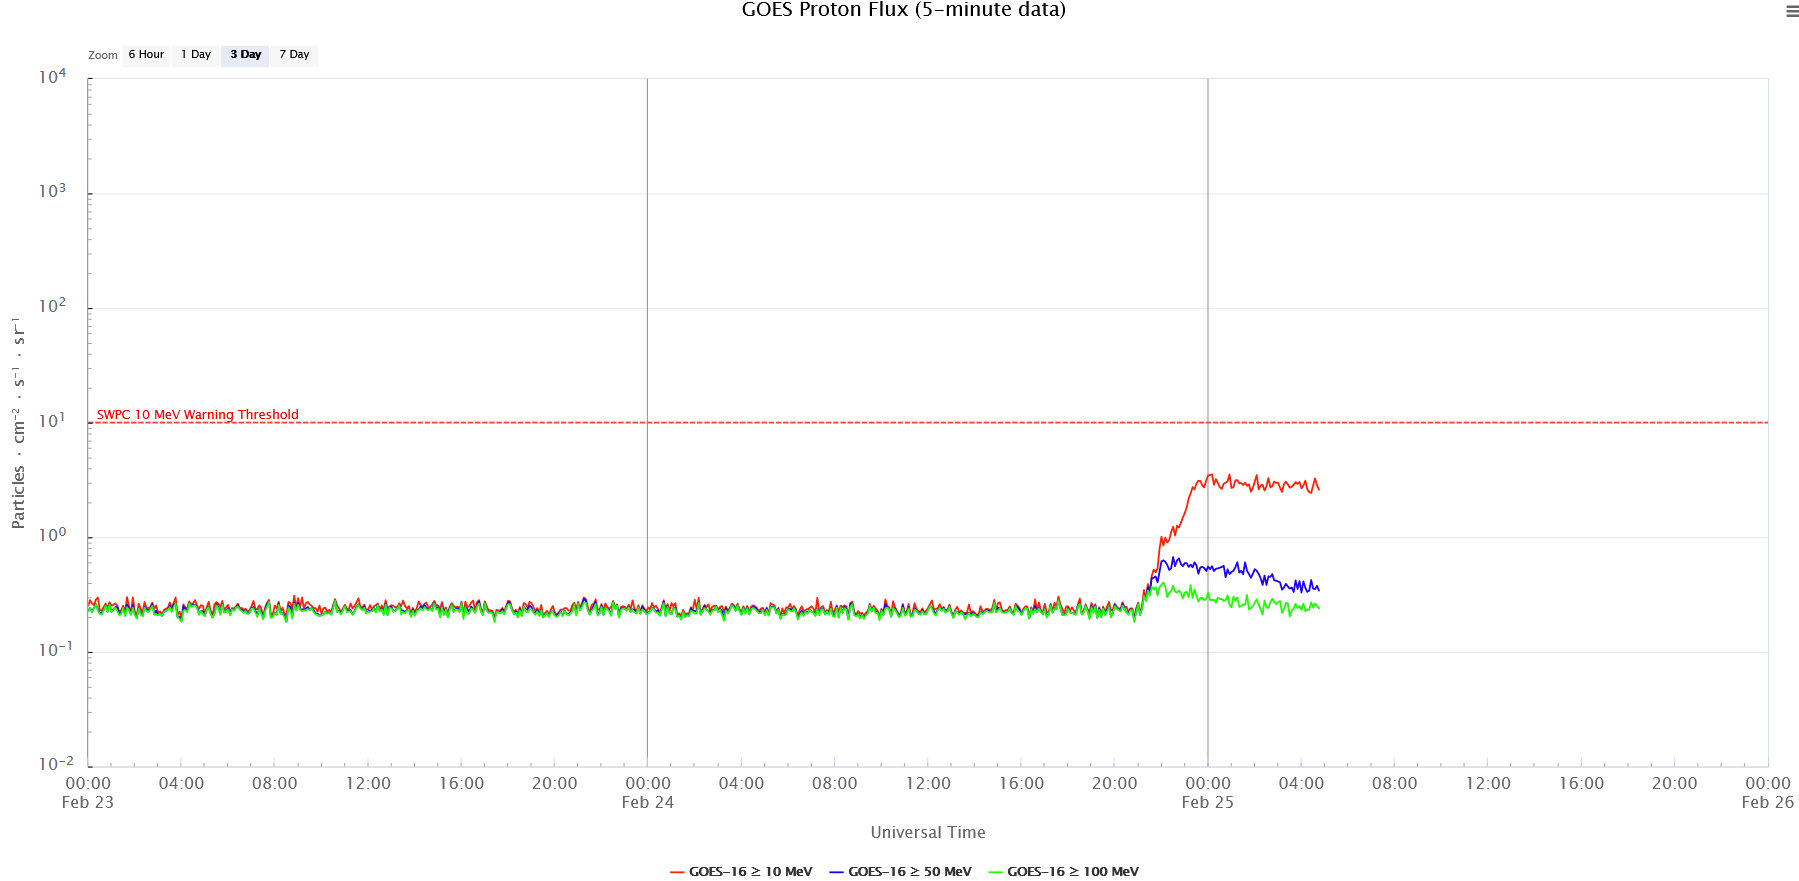
From NOAA spaceweather.com
Shock waves inside the CME accelerated protons (our DNA positive+charge) to nearly light speed, and they have already reached Earth.
These are the 52-day light emanations as TIME; the Tzolkin, or count of days as evolution through the Loom of Maya from our mothers. They are different colors because they are different Hz frequencies of SOUND via The Tones of Creation 1-13. Light comes from sound. But what is the Source of sound?
The Psi Bank Magnetosphere ScR
Frequency is 7.94, and amplitude is 35
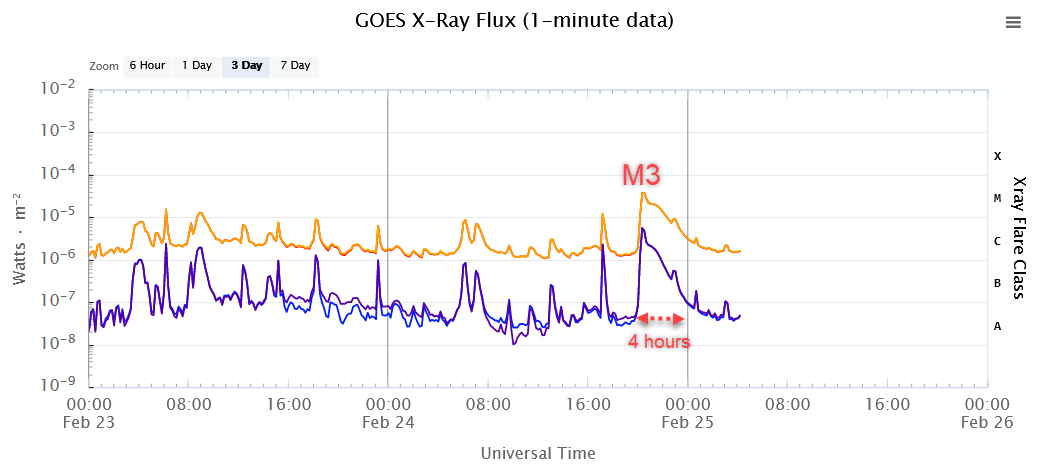
A CHAIN REACTION ON THE SUN: A magnetic filament connected to sunspot AR3229 erupted on Feb. 24th (1949 UTC), Friday, producing a chain reaction of events. First, the filament sliced through the sun’s atmosphere:
Its liftoff destabilized the sunspot, sparking a long duration M3-class solar flare (2030 UTC). The flare, in turn, ionized the top of Earth’s atmosphere, blacking out shortwave radio transmissions around the Pacific Ocean: map.
Next, a CME emerged from the blast site. Coronagraph images from SOHO show a lopsided halo with an Earth-directed component:
Type II solar radio emissions from the leading edge of the CME suggest a departure speed of 1200 km/s (2.7 million mph). The flank of the CME could reach Earth on Feb. 27th. NOAA analysts are modeling the storm cloud now, so stay tuned for a refined forecast.
I will handle some of this for you when I post. There is no reason you can’t do it as well. I want you to understand your own brain. This way, you can notice these changes yourself instead of running to the doctor. Our bodies are getting an ascension shakeup.
Lightbody Reconnect- A Blog from ReconnectYourself.com
This is from the creator of the SR monitor in Siberia:
How to Read the TSU (Tomsk Siberia University in Russia)- Schumann Resonance (SR) Chart
I’ve had several requests asking how to read the Schumann Resonance (SR) chart I’ve been posting. I use the SR monitoring at the Space Observing System at Tomsk Science University, located in Siberia. Let me first note that the following suggestions are not any official guidelines from the SOS. They are my personal observations and practices. I have read these charts for several years.
Here is a sample chart you can refer to. But first, a definition of the Schumann Resonance: “The Schumann resonances (SR) are a set of spectrum peaks. These peaks are in the extremely low frequency (ELF) portion of the Earth’s electromagnetic field spectrum. Schumann resonances are global electromagnetic resonances. Lightning discharges generate and excite them in the cavity formed by the Earth’s surface and the ionosphere.
In the normal mode descriptions of Schumann resonances, the fundamental mode is a standing wave in the Earth-ionosphere cavity. Its wavelength is equal to the circumference of the Earth.” (Wikipedia)
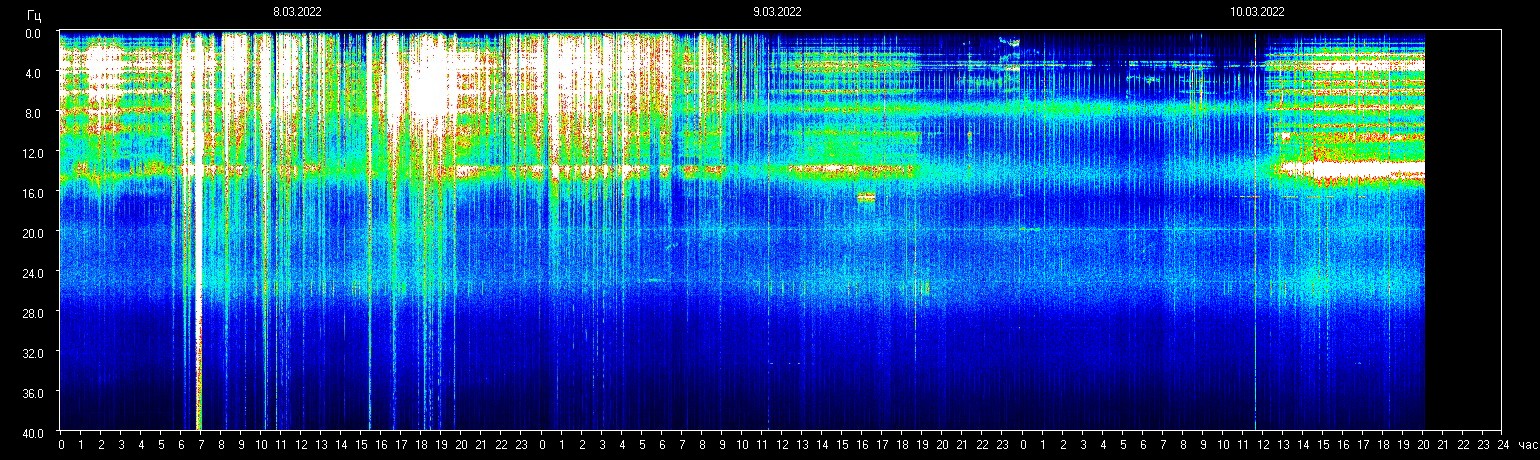
Now, to the chart (“spectrogram”)
(Lisa wrote this part); The date at the top is 10/3/22. We write it 3/10/22 so it’s today. It starts at 14:00 hours Siberia time which is 2 PM so adjust that for your time zone. I’m in the U.S. EST. Minus 11 hours, it occurred at 3 am this morning. My brain woke straight awake. I had to drink some warm milk to get back to sleep. It contains tryptophan which makes you sleepy.
Today it looks to me like it was in the 15-24Hz range. You can see it if you follow the light green all the way to the bottom. We are easily getting Beta blasted today. This is very high for our brains. It is close to Gamma, which is related to bursts of rational insight and ideas. The intuitive insight which I hum in all the time is Theta. Every day I’m between theta and alpha. Alpha means your eyes are open and you’re conscious of the 4D hologram. Theta is a meditative state. I think beta and gamma states mean you’re too hyped up on coffee or sugar. You might be bouncing off the walls. When the SR gets to that level you need to calm yourself down with rest, herbs, tea, and meditation.
Hertz values are on the vertical left
DATES: Look at the top of the chart. You’ll see that the chart divides into three-day sequences, with the dates printed across the top horizontal of the chart. Dates move left to right, most recent on the right.
TIMES: Next, look at the bottom of the chart. You’ll see the times. They present in a 0-24 hour sequence. There is one block of 24 hours for each corresponding date above. The chart uses local Tomsk (Siberia) time which is GMT+7. You’ll need to convert the chart times to your local time.
I’m in the US, so the equivalents here are United States Conversions:
Eastern (GMT-4): Chart minus 11 hrs
Central (GMT-5): Chart minus 12 hrs
Mountain (GMT-6): Chart minus 13 hrs
Pacific (GMT -7): Chart minus 14 hrs
SR VALUES:
Now, look at the left vertical side of the chart. These numbers provide a framework for reading. They show the Schumann Resonance peak values in Hertz levels (like the Tzolkin). The lowest values start at the top. They progress to the highest at the bottom in increments of 4Hz. SR frequencies are relatively stable and do not change. Also, there is not just one SR frequency, but an array of peak frequencies. The SR values cover a range from 3 Hz to 60 Hz, with set values at intervals roughly 6.5 Hz apart, except for the lowest value, 4.11.
Different authorities post slightly different values for the SR peaks. Here are the rounded-off SR peak values pretty much agreed upon universally: 4, 7.83 (fundamental SR), 14, 20, 26, 33, 39, 45, 59. All measured in Hz or cycles per second. The SR frequencies are read ACROSS or HORIZONTALLY, usually in the green intensity shade.
You can easily track a specific frequency through the 3-day cycle. You’ll see that the green lines typically indicate at the 7.83, 14, 20, and 26 Hz frequencies. Other frequencies you’ll see, less frequently, are the lowest, 4 Hz, and 33 Hz and higher.
SR AND HUMAN BRAINWAVES
Here’s the cool part: These Schumann Resonance ELF (Extremely Low Frequency) waves are in the Earth’s magnetic field. They overlap with the electrical patterns. These patterns are the “brain waves” observed across the cortex of the human brain. Studies have shown that SR frequencies have particular effects on the human brain and nervous system. They also affect the cardiovascular system. The autonomous nervous system, circadian rhythms, immune function, DNA, and more are influenced too.
The fundamental Schumann Resonance, 7.83 Hz, corresponds to the high theta of the human brainwave range. Human brainwaves and SR correspondences:
Delta: 0 Hz to 4 Hz corresponds with SR 4.11Hz
Theta: 4 Hz to 8 Hz corresponds with SR 4.11 Hz, SR 7.83 Hz
Alpha: 8 Hz to 12 Hz corresponds with SR 7.83 Hz
Beta: 12 Hz to 30 Hz* corresponds with SR 14 Hz, 20 Hz, 26 Hz
Gamma: 30 Hz to 100 Hz corresponds with SR 33 Hz, 39 Hz, 45 Hz, 59 Hz
*There are differing opinions among authorities as to the demarcation between the upper limit of beta and the onset of gamma brainwaves. Some cite 25 Hz, others 40 Hz. Most seem to cite 30 Hz. Just know that the upper value is a bit fluid.
COLOR CODE
Intensity readings go from lowest blue (background intensity) to green to yellow to white (highest). Typical SR readings are in the green range. IMPORTANT: The SR is read HORIZONTALLY, so you’ll be looking at the green horizontal lines. (Do not consider the VERTICAL white lines or white ‘splashes’ as SR readings.) VERTICAL WHITE LINES/SPLASHES: So, what ARE those vertical WHITE lines or wider splashes?
In general, they represent energy bursts or ionospheric plasma excitations. (THE PSI BANK EMANATIONS-Lisa T.) For the most part, the electromagnetic (ELM) bursts are probably lightning-related or TLE-related. Lightning (Blue Storm tribe; Tryptophan) is THE major driver of the SR. Electromagnetic bursts have often been found to be sprites. Sprites are a type of lightning phenomena that occurs high in the atmosphere. Now, many of the Schumann resonances transients (Q bursts) are thought to be connected to transient luminous events (TLEs).
In 1995 Boccippio et al.[38] showed that sprites, the most common TLE, are produced by positive cloud-to-ground lightning. It occurs in the stratiform region of a thunderstorm system. They are accompanied by Q-burst in the Schumann resonances band.” (Wikipedia) Transient luminous events (TLEs) are upper atmosphere electrical discharges such as sprites, ELVES, and jets. To read more about transient luminous events, here’s a good article, with photos: https://weather.com/news/news/transient-luminous-events-mysteries-sky-20130731
In addition to intense lightning and TLEs, plasma excitations could also be caused by: — intense thunderstorm — solar activity (e.g. solar winds, CMEs, solar flares) — geomagnetic disturbances (resulting from solar activity) — some speculate HAARP and scalar weapons discharges may affect the SR — energy bursts of unknown origin EFFECT OF ENERGY BURSTS ON SR READINGS:
When ionospheric plasma gets excited, the SR waves at various resonances can get excited, as well. You’ll often see a wider, “puffier” green color displayed behind, around, or following an energy burst. You may see the “excitation” activate the higher SR values that correspond with the brain’s higher beta and gamma frequencies. I often call these the “transformation waves.”
Energy bursts can also trigger the low 4.11 Hz SR and the fundamental 7.83 Hz that correspond to our theta brainwave. This wave is incredibly transforming, as well. It’s been called the “miracle wave” for its deep healing, calming, and rebalancing qualities; theta accesses the subconscious mind. These energy bursts first started happening back in 2014. The human monitors at the Space Observing System at Tomsk Science University initially suspected an equipment malfunction. They initially thought it had caused the anomaly. But upon checking, they realized that the equipment was fine. It had, indeed, recorded SR values in a higher range not seen before. But as to the origin of the spikes, they had no answers.
A SPECULATIVE OBSERVATION: When these plasma spikes occur, humans might be receiving a double impact. The SR frequencies resonate with our brain waves (theta, alpha, beta, and gamma). We also feel the effects of the ionospheric energy bursts themselves. For those who are energy-sensitive, these plasmic excitation’s or energy disturbances may be felt or sensed. Sensitives can ‘feel’ phenomena like geomagnetic storming, distant earthquakes, or volcanoes. They can also sense the full moon’s magnetic pull or incoming photonic or cosmic energies.
Back to the Schumann Resonance:
“Every second, a multitude of pulses travel around the world in this unique, resonant chamber between Earth and the ionosphere, sending colluding signals to all microorganisms. These signals couple us to the Earth’s magnetic field. Named after their discoverer, these Schumann Resonances (SR) drive the harmonizing pulse for life in our world.”
This enhancement was discovered by Edward Appleton in 1946. Credit: NASA’s Scientific Visualization Studio
This is a visualization of the Equatorial Fountain process in the ionosphere, whereby ions are driven away from the equator forming ion density enhancements to the north and south of the equator. Ions are just positive and negative charged particles.
This visualization is depicted near 50 degrees west longitude, where the magnetic equator crosses the geographic equator. (Yellow Warrior Time Portal?) Magnetic field lines near Earth are represented by the gold lines. Particles appear in a blue-white flash, representing the point where atoms are ionized, becoming positively charged (a proton) and releasing an electron (negative charge).
Now these charged particles can ‘feel’ the near-Earth electric and magnetic fields. Their motion becomes a combination of circular gyromotion due to the magnetic field and E-cross-B drift. At higher altitudes, the electric field is weaker, reducing the vertical motion, and the ion motion becomes dominated by the magnetic field and gravity, allowing the ion to ‘slide’ down the magnetic field line back to Earth.
At lower altitudes, the ions combine with free electrons in a process called recombination, represented by a red flash and fading of the particle trail. A slice of data from the IRI (International Reference Ionosphere) model represents the density of singly-ionized oxygen atoms is faded-in to compare to the particle motion. Red represents high ion density, green represents low ion density.
The camera finally pulls out from Earth, providing an overview of the enhanced ion density (red) above and below the magnetic equator on the dayside of Earth.
On this blog this comes under accurate EARTH HOLON information. I post the reading every day. It has changed quite a bit in two years as we’ve hopped timelines.
A Van Allen radiation belt is a zone of energetic charged particles that are captured by and held around a planet by that planet’s magnetosphere. Earth has two such belts, and sometimes others may be temporarily created. Here it is in Earth Ascending. Definitely click on this to enlarge and see it clearly.
Map 28 of Earth Ascending; Earth’s Magnetic Field-The magnetosphere measured by the Schumann Resonance
This is very complicated. One more thing in this book that I need to ponder.
“Here the four plates and their division into eight seasonal parts are depicted in their actual resonant spherical relation to the earth and its magnetic field. The more detailed map on the left depicts the flow of civilization within the context of the major longitudinal division. The actual psi bank plates are referred to as holonomic recollection plates while the corresponding geographical equivalents are referred to as psi seasonal resonance field memory plates. Also indicated in the left-hand map are the geographical sites corresponding to the temporal or sequential arrangement of the kua of I Ching, starting with the spring equinox, northern hemisphere, along hieratic longitude zero. In the diagram to the right, which shows more fully and simply the relation of earth to the electromagnetic fields and psi bank, the kua are arranged in their earlier or celestial/electromagnetic relation to each other.
As we have seen, what we refer to as history is actually a function of a much larger, integrative global harmonic. The guiding factor of this historic harmonic is the psi bank with its holonomic recollection plates. Each of these plates may be envisioned as carrying and/or simultaneously containing levels of information that connect stages of organic/cyclical seasonal growth; geo-cultural information—-psions—-as well as information concerning successive and cumulative stages of the psycho-cultural process—history itself.
What this points to is the study of history as a geological sub-field in an overall study of psycho-atmospheric harmonics as monitored by the guiding factor, the psi bank. Thus, in order to better understand and evaluate “what happened in history, ” it is best first to understand the guiding function, structure, and nature of the psi bank itself.”-
Earth Ascending by Jose Arguelles
This is mainstream science, truth as far as they are concerned. Tzolkinists call it the Psi Bank and it’s the source of the Tzolkin Harmonic. It is the Earth’s mental field. MSS (mainstream science) calls it The Van Allen Belts for James Van Allen who is credited for their discovery.


You must be logged in to post a comment.