
Today we enter HF53, the power of universal Water. This is a self-existing process as we move to Yellow 4 Human by Thursday. We have to formulate the FREE WILL to be in whatever FORM we wish. That’s part of why we celebrate July 4. FREEDOM TO BE who we are in truth.
We also enter a new 52-day cycle called a castle. This is the Green Central Castle of Enchantment that we haven’t quite gotten the key to yet, like the Emerald Castle in the Wizard of Oz. We have a wizard too. The White Wizard Tribe of Tiamat, the asteroid belt. This is THE COURT of the matrix whose purpose is to synchronize humans to the universal stream of life and other species
We hit I Ching Hx21 4-day cycle: Biting Through Reform-3D Nucleotide 100101

Current circumstances call for confronting a thorny situation and cutting through it. Somehow, the way to harmony and unity is blocked or frustrated—perhaps by a tangle of deceit or corruption. (That’s an understatement) Like Alexander the Great cutting the Gordian knot, take decisive action and you will meet with good fortune and even your destiny. Don’t be afraid to shake things up a bit. The ability to take corrective measures when they are needed is an essential trait of leadership.
Those who bring discipline to bear must, above all, be honest—with others and with themselves. Honesty is the hallmark of the strong and self-confident. The successful person masters the art of honesty like the swordsman masters fencing. When lies, delusions, and game playing are getting in the way of teamwork, the swift sword of honest action, perhaps even punishment, must be wielded to protect integrity and values. Decisiveness with integrity will bring good fortune.
Though your actions may be vigorous, they must not be hasty, severe, or arbitrary. Be sure to carefully consider all the circumstances. In the case of a serious disruption of relations or events, forgive but don’t forget—at least not until the person has made reparation for his or her mistakes. If corrective action is necessary, make certain that it truly fits the crime. When rules have become slack and useless, only through the institution of clear and swift penalties can their effectiveness be restored.
In those situations where serious issues of justice are at stake, keep careful records; and do not hesitate to go public with the truth.
PCU 13.10
Water is both mirror and messenger. It is always moving for release.
Solar System Sync 3D
The proteins are 1 Methionine Start Codon, 1 Aspartic Acid, 1 Met again, 1 Tryptophan, and 13 Glutamic Acid.
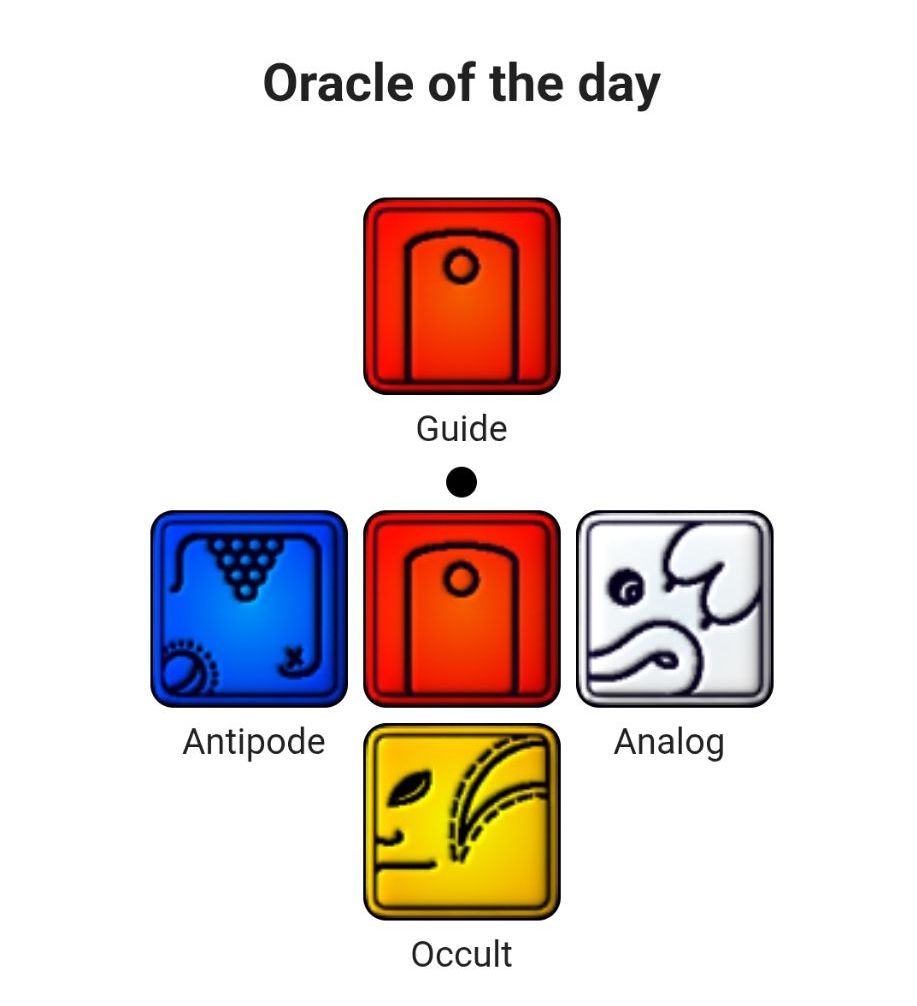
We have a water sign, Pisces Moon water sign until 11am. Then it gets down to business with an Aries Moon at 11am and the Sun square Saturn. This is in sync with the oracle moving from self-generative Blue Storm to Yellow Human.
There is a strong feeling of starting over emotionally with some aspects of our evolution. I think we needed to rethink how we were going to get to harmony and peace because of our previous actions on Kin 208, Yellow 13 Star in the deep past.
- The Sun forms a square with Saturn today, bringing on a rather cautious and serious energy to our lives. We can experience a decline in vitality and encounter obstacles and challenges. Sacrifices may be necessary. However, these very things can help us recognize our ability to overcome challenges, boosting our sense of self-reliance. It can be a time to face reality, recognize the practical side of a situation, and assume more responsibility. Generally, with this aspect in play, it’s best to conserve energy and downplay the ego rather than fight or push things. This is a time for thinking about what’s best in the long term, and it may mean forgoing or limiting something in the present.
- The Moon continues to transit Pisces in a void until 11:07 AM EDT, when it heads into Aries. The Aries Moon forms rich aspects today, pointing to increased confidence and opportunities as the day advances. We want to start fresh, and we’re less interested in the past than in what will work for us today and going forward.
- The Moon is void from 1:21 AM EDT, with the Moon’s last aspect before changing signs (a trine to Mercury), until the Moon enters Aries at 11:07 AM EDT. (Mercury mediates our whole day so this is a big SYNC).
From cafeastrology.com 🌒 🌟 🪐
The 5gforce Mantra for Mindset
I endure in order to play. Transcending illusion I seal the process of magic with the cosmic tone of presence. I am guided by the power of vision.
Kin 91: Blue 13 Cosmic Monkey
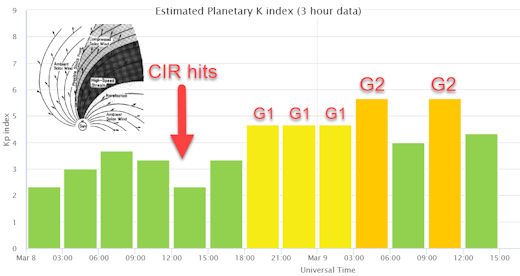
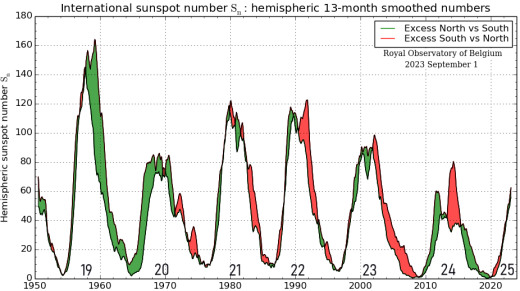
Astronomy-NOAA


You must be logged in to post a comment.