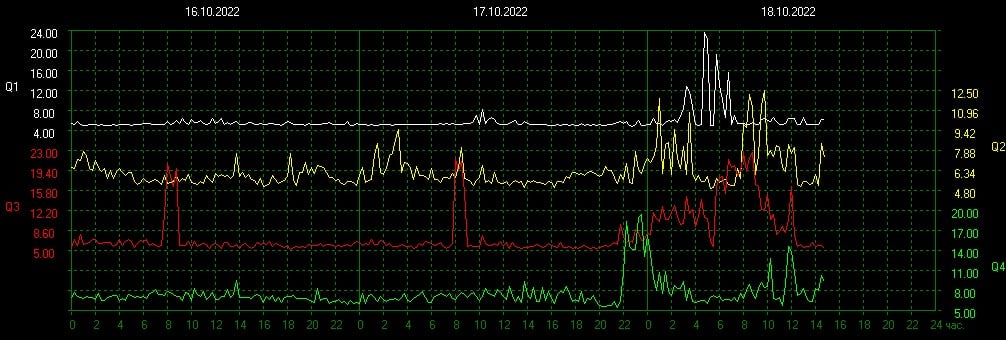
Q factors of the Schumann resonances are the factors which represent the sharpness of resonances of the earth ionosphere cavity. The earth as the lower boundary of the cavity can be recognized as a perfect conductor, while the ionosphere as an upper boundary is a leaky wall which has finite conductivities.
“An inverse relation between Q factors and solar activity was found and it is concluded from this that the effective height of the upper boundary of the cavity decreases as the sun becomes active. It is suggested that the sun may have some effect in modifying the conductivity profile below 56 km of the atmosphere.”-from the ScR pdf
You can see the Consecutive spikes in the Q spaces of the layers of magnetosphere; Q1, Q2, Q3, Q4 which was the highest at 24.
I believe these are indicative of the depth of the ELM energy into the earth from the local system and causing quakes.
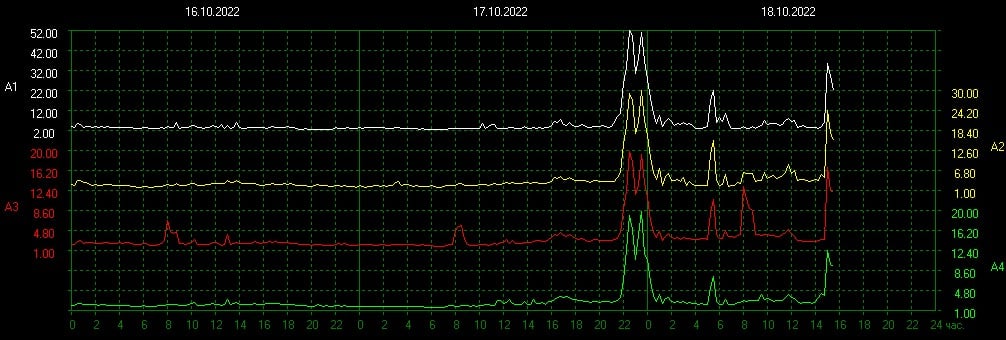
Since 4am the power frequency has gone up 18%. The Sun is reacting to another evolutionary shift.The amplitude power is still 52 in all 4 Psi Bank cavities. The lowest one on the bottom is the earth and the top one is the ionosphere.
The peak frequency is 75. Do your best to problem solve rationally rather then indulge in emotion which does not help. Error and mistreatment are epidemic right now. Avoid first, then check, then run. That’s the martial arts way.
Since the main ionization source is solar EUV, every planet and moon with an atmosphere also possesses an ionosphere. (a Psi Bank) At IRF-Uppsala we study ionospheres of Earth, Mars, Saturn’s moons Titan and Enceladus.Feb 1, 2021
When Ben legitimately posts what is happening on the Sun and he says, “The CME is pointing away from the earth and won’t affect us much if at all.”, it is hitting one of the other nine planets because the Sun is reacting to them also. It would be narcissistic to think our Sun was just for us or just reacting to or picking on us. That is not the case at all. In fact, the Sun is keenly tied into the entire cosmic web grand universe-wide so its function in our local system, serving our local system, is by no means trying to DESTROY US.
Why does no one talk about this? Because they are selfish and have an agenda that might not be the most positive for humans. Anyone who cooperates with NASA I question. I’m not saying NASA is always wrong but they work for the Federal c+_)(. They have to shore up the official narrative in a big way just as the sick-care does.
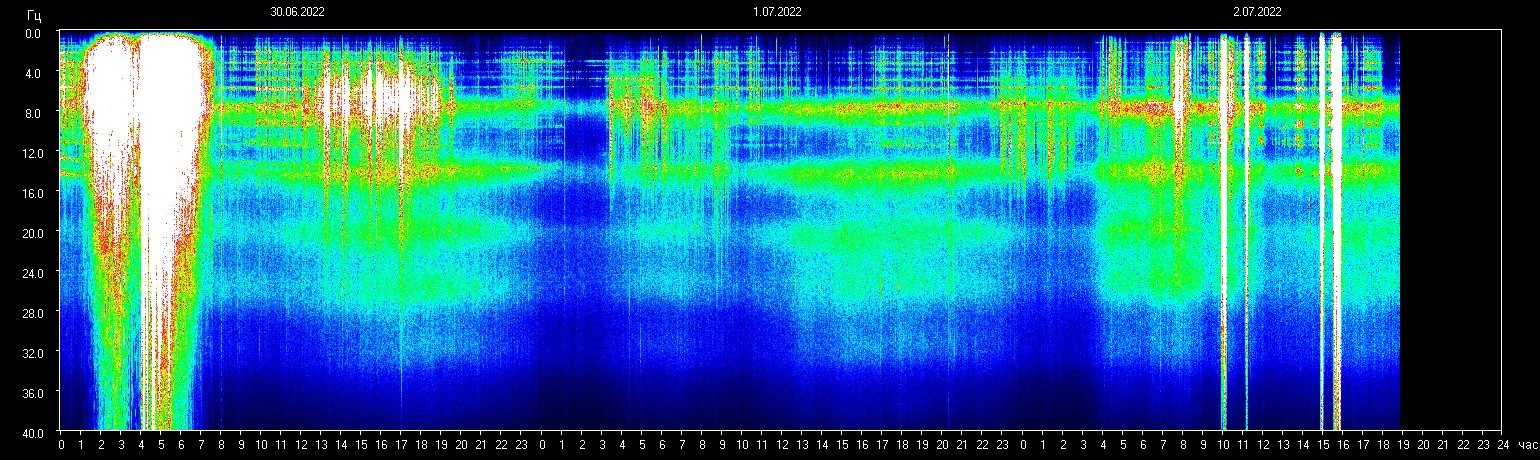
The Schumann resonances (SR) are a set of spectrum peaks in the extremely low frequency (ELF) portion of the Earth’s electromagnetic field spectrum. Schumann resonances are global electromagnetic resonances, generated and excited by lightning discharges in the cavity formed by the Earth’s surface and the ionosphere.
Why Put Them in an App? The Schumann resonances are tied to an elevation in human consciousness. When there are spikes in activity people have noticed a change in behavior. The apps have been created in order to allow for people to easily check the status of the Schumann on their phones. This is just an easy-check of where the levels are.
This enhancement was discovered by Edward Appleton in 1946. Credit: NASA’s Scientific Visualization Studio
This is a visualization of the Equatorial Fountain process in the ionosphere, whereby ions are driven away from the equator forming ion density enhancements to the north and south of the equator. Ions are just positive and negative charged particles.
This visualization is depicted near 50 degrees west longitude, where the magnetic equator crosses the geographic equator. (Yellow Warrior Time Portal?) Magnetic field lines near Earth are represented by the gold lines. Particles appear in a blue-white flash, representing the point where atoms are ionized, becoming positively charged (a proton) and releasing an electron (negative charge).
Now these charged particles can ‘feel’ the near-Earth electric and magnetic fields. Their motion becomes a combination of circular gyromotion due to the magnetic field and E-cross-B drift. At higher altitudes, the electric field is weaker, reducing the vertical motion, and the ion motion becomes dominated by the magnetic field and gravity, allowing the ion to ‘slide’ down the magnetic field line back to Earth.
At lower altitudes, the ions combine with free electrons in a process called recombination, represented by a red flash and fading of the particle trail. A slice of data from the IRI (International Reference Ionosphere) model represents the density of singly-ionized oxygen atoms is faded-in to compare to the particle motion. Red represents high ion density, green represents low ion density.
The camera finally pulls out from Earth, providing an overview of the enhanced ion density (red) above and below the magnetic equator on the dayside of Earth.


You must be logged in to post a comment.