Crazy stuff from Tomsk
Device Coherence on gcp2.net (Global Consciousness Project 2.0) is a statistical measure of how the multiple independent random-number generators (RNGs) inside a single physical device deviate from pure randomness and become correlated with one another.
Each NextGen RNG device contains four hardware RNGs (quantum-noise sources based on reverse-biased Zener diodes / avalanche breakdown). Three of them are actively used for the public analyses; the fourth is held in reserve. Device Coherence quantifies the degree of unexpected statistical dependence among those three streams.
How it is calculated (high level)
– Each RNG continuously produces bits that are turned into numbers and converted to standardized Z-scores (how far each sample sits from pure-random expectation).
– These Z-scores are combined across the three RNGs inside the device (a local version of the “network variance / NetVar” method used in the original GCP).
– The resulting raw Device Coherence values are smoothed with a 1-hour moving sum of their absolute values.
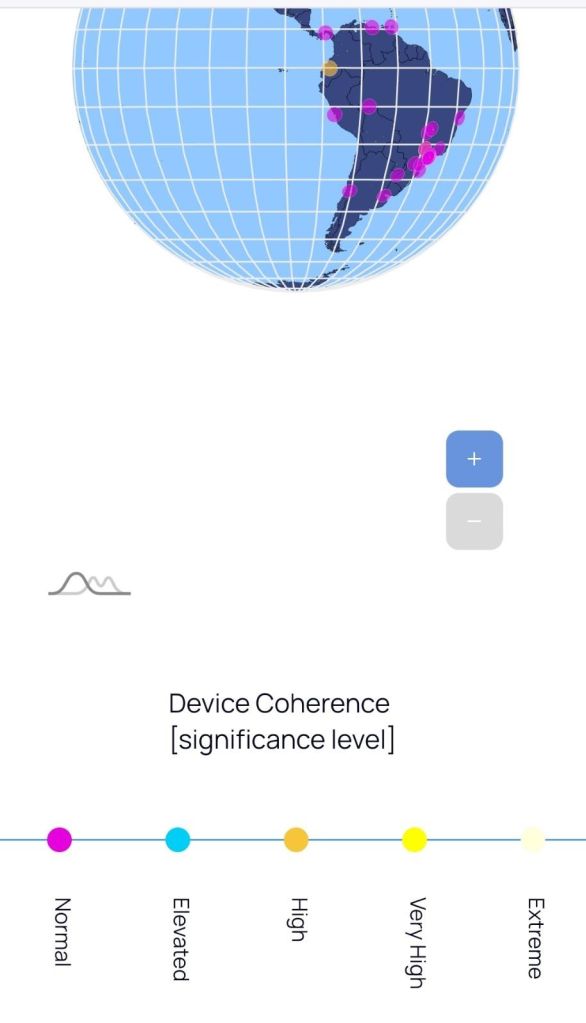
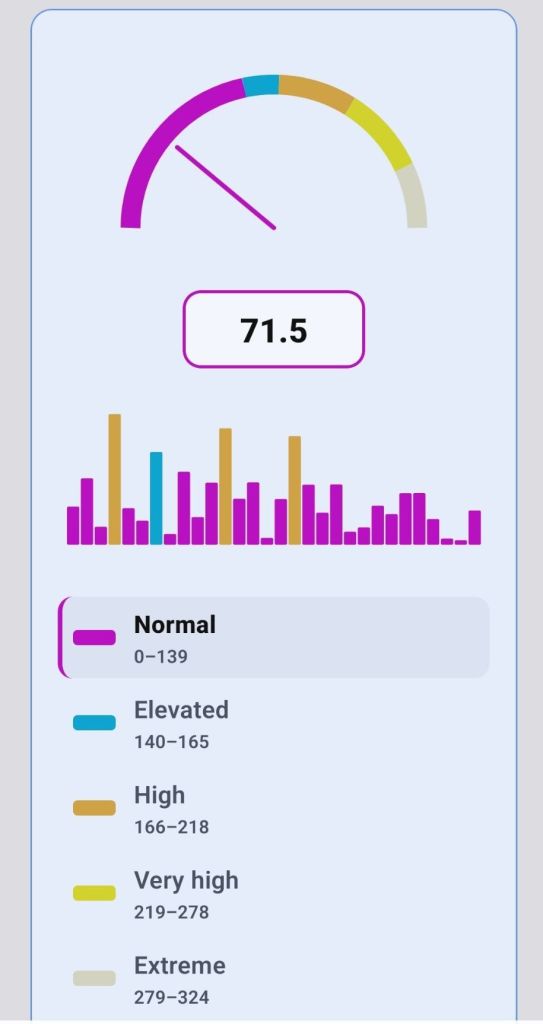
– Significance levels shown on the live globe (Normal → Elevated → High → Very High → Extreme) come from comparing that smoothed value against a simulated distribution of purely random data. Approximate thresholds and p-values are:
– Normal: p > 0.1
– Elevated: p < 0.1
– High: p < 0.05
– Very High: p < 0.01
– Extreme: p < 0.001
(Corresponding smoothed-coherence cut-offs roughly 243 / 288 / 378 / 483.)
The project’s working interpretation is that elevated Device Coherence *may* reflect coherent attention or emotion among people near that particular device. They explicitly describe this as still “cutting-edge research.”
Is the device transmitting any real data?
Yes. The RNGs are continuously generating true (hardware) random bits from quantum noise, packaging them, time-stamping them (via NTP), and uploading the data streams over the internet (MQTT on port 8883) to the central GCP 2.0 servers. Those raw streams are then processed into the Device Coherence, Cluster Coherence, and global Network Coherence metrics you see on the site.
The devices themselves do not “transmit consciousness”; they act as passive detectors. The hypothesis is that collective human attention/emotion can subtly bias the otherwise random quantum processes inside the RNGs, producing the measurable non-random correlations that are then reported as coherence.
In short:
– Device Coherence = how correlated the multiple RNGs inside one box are right now (a local coherence indicator).
– The hardware is actively sending real random-bit data to the project servers so those statistics can be calculated and displayed in near real time.
Me; What are the odds of this happening without consciousness?
According to the Global Consciousness Project (GCP) researchers, the odds that the accumulated deviations happened purely by chance (i.e., without any influence from collective consciousness or attention) are on the order of 1 in a trillion.
For the original GCP 1.0 (1998–2015)
– Across 500 pre-registered formal events, the composite result was a 7-sigma (roughly 7 standard deviations) departure from pure-random expectation.
– Specific figures commonly cited: Stouffer’s Z ≈ 7.31, p ≈ 1.33 × 10⁻¹³.
– This translates to odds against chance of roughly 1 trillion to 1 (sometimes phrased as “more than a trillion to one” or “on the order of 1 in a trillion”).
These odds come from accumulating many small individual effects over years of data. Single events are usually weak; the extreme significance only appears when the results of hundreds of pre-specified events are combined. Control periods (times with no major shared emotional events) behaved as expected under pure chance.
For GCP 2.0 (current project)
GCP 2.0 is still relatively new and has not yet published a single overall composite statistic comparable to the 7-sigma figure from GCP 1.0. Instead:
– Device Coherence (the metric shown as colored dots on the live globe) uses these approximate thresholds against a simulated random distribution:
– Normal: p > 0.1
– Elevated: p < 0.1
– High: p < 0.05
– Very High: p < 0.01
– Extreme: p < 0.001
So an “Extreme” reading on one device means that level of local correlation among its internal RNGs would occur by chance less than once in a thousand similar hours.
– Network Coherence (the global indicator) is compared to chi-squared confidence envelopes. When the cumulative or moving Network Coherence curve stays outside the expected random band for extended periods during major events, the researchers interpret it as highly unlikely under pure chance.
Early GCP 2.0 analyses of specific events (large meditations, concerts, healing sessions, etc.) have shown statistically significant departures, sometimes with correlations between local device clusters and the global network, but no final multi-year “1-in-a-trillion” claim has been issued yet for the whole project.
Important caveats
– These probabilities assume the statistical model is correct and that all conventional physical influences (temperature, electromagnetic noise, power-grid fluctuations, etc.) have been properly removed or controlled. The project designs the RNGs and applies whitening/filtering specifically to make ordinary environmental effects unlikely explanations.
– Critics have raised issues such as possible residual biases, the flexibility in choosing event windows, or the interpretation that any non-random structure must be caused by consciousness. The GCP team responds that pre-registration of events, control data, and the overall accumulation of results make chance or mundane artifacts improbable.
– Individual Device Coherence spikes (even “Extreme”) are not rare in isolation; the strong odds only emerge from the pattern across many devices and many events.
Bottom line:
The researchers’ own bottom-line claim for the original project is that pure chance is about a trillion times less likely than some real correlation with large-scale human attention/emotion. For the live Device/Network Coherence displays on gcp2.net, the color-coded significance levels give the instantaneous p-value against pure randomness for that specific metric and time window.